

Mnova Combos allow you to enjoy several Mnova plugins at the same time while you get important savings!

|
Chemical shift perturbation analysis for fragment-based drug discovery A powerful tool that automatically processes 2D HSQC type of protein-ligand titration spectra, tracks the peak movement and computes the Kd‘s for multiple peaks. > GET A LICENSE |
Designed to carry out the quantitative chemical shift perturbation (CSP) analysis of 1D and 2D NMR titrations. |
Binding
|
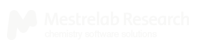
Intuitive workflow that allows you to analyze CSP titration spectra interactively or fully automatically. Automatic peak movement tracking and measurement of chemical shift perturbations (CSPs), fitting them to the concentrations of ligands to compute Kd. Corrects the automatic peak movement tracking in crowded spectral areas. Provides tools for processing and stacking multiple 2D HSQC spectra. It displays them in different colors. Easy exporting of CSP values for further studies of the ligand-protein binding models. |

|
Mnova Binding includes a FREE 1-year license of AFFINImeter for NMR AFFINImeter for Nuclear Magnetic Resonance allows the advanced analysis of binding isotherms from 2D NMR titrations to measure binding constants (KA). The binding isotherms are imported directly from the software Mnova and a series of advanced tools are available in AFFINImeter-NMR to get the most out of your NMR data including: Global analysis of binding isotherms Analysis with complex binding model Advanced algorithms to guarantee convergence avoiding local minima, as well as to assess the parameter uncertainties, the goodness of fit and result reliability
|
Binding
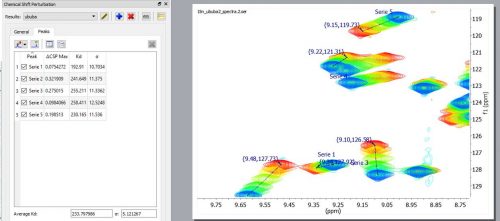
Stacked HSQC spectra with CSPs automatically tracked and measured. Figure on the left shows the movement of two assigned peaks . The one on the right shows the details of one of the tracked peaks, “13C-H”, including the ratios of concentrations of ligand/protein, the measured CSPs in either dimension, the normalized CSPs, and fitting results of Kd and error.
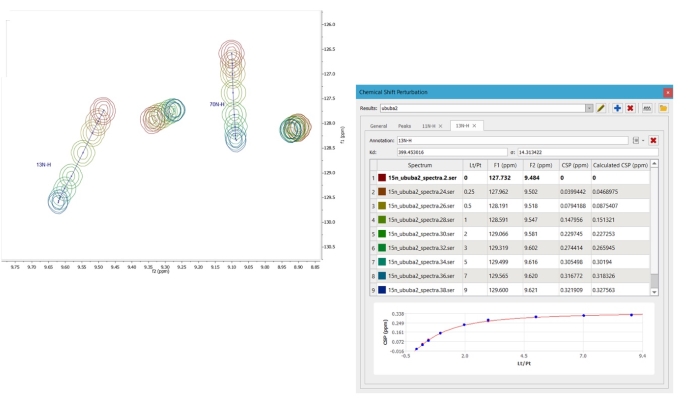
The general tab of Chemical Shift Perturbation shows a listing of the color scheme for the titration spectra, protein concentrations, ligand concentrations, and ratio of concentrations of ligand vs protein.
It also shows a list of the CSP measurements and Kd fitting for all the analyzed peaks, and the average and standard error of the Kd’s.
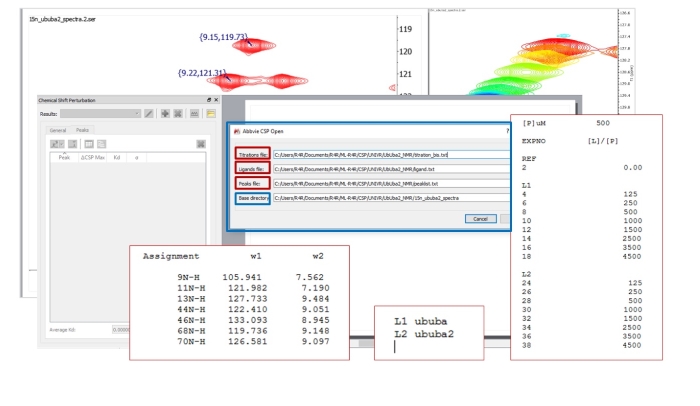
Series of titrations can be specified just by listing them sequentially in the “titration file”. Names for ligands used are coded in the “ligands file”. When CSP automatically runs the analysis it creates different Mnova files for each titration listed in “titration file” and Mnova documents are named accordingly to ligands’ names.
Binding Academic, Government & Industrial
|
|
Binding
|
✈:No. 377, Nanjing Road, Shibei District, Qingdao, Shandong
☏:0532-83818797 / 18561885100
✉:changzhu_ ji@tlwb.com.cn shuochao_dai@tlwb.com.cn support@tlwb.com.cn
Learn more |
 |


 鲁公网安备 37020302371618 鲁ICP备13025756号-1