

Mnova Combos allow you to enjoy several Mnova plugins at the same time while you get important savings!


|
Analysis for the determination of a biologic drug’s higher order structure Mnova BioHOS is designed for the NMR analysis of biotherapeutics, like monoclonal antibodies. 2D NMR spectra of reference samples are compared with that of each test sample using a fingerprinting, or spectral similarity determination. Licenses of Mnova NMR and Chemometrics are required to use Mnova BioHOS
> GET A LICENSE |
Designed in collaboration with Bruker BioSpin, Mnova BioHOS capabilities will support your analytical needs for the Quality Assessment of Biologic drugs using 2D NMR spectral data.
Designed in collaboration with Bruker BioSpin, Mnova BioHOS capabilities will support your analytical needs for the Quality Assessment of Biologic drugs using 2D NMR spectral data. |
BioHOS
|
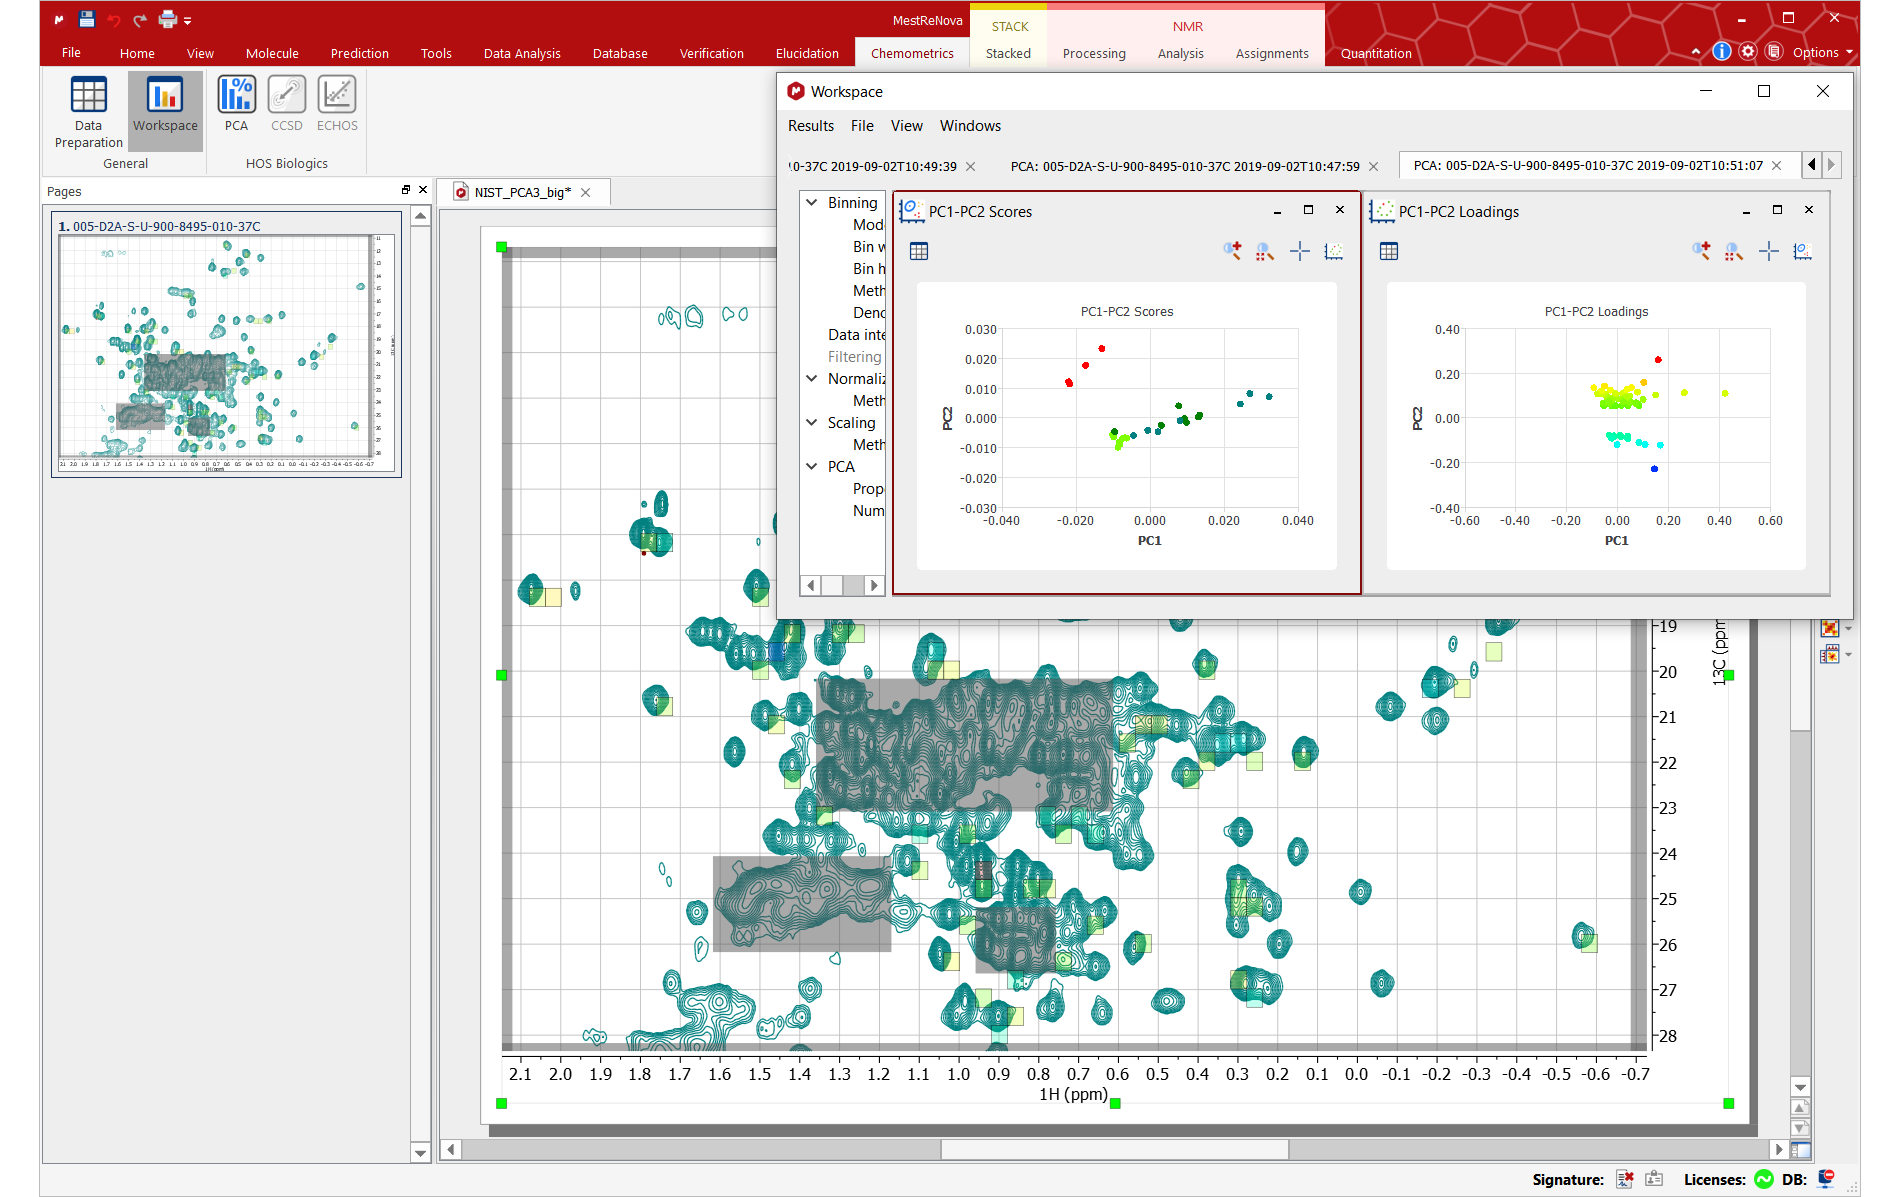
Mnova BioHOS – NIST mAb data
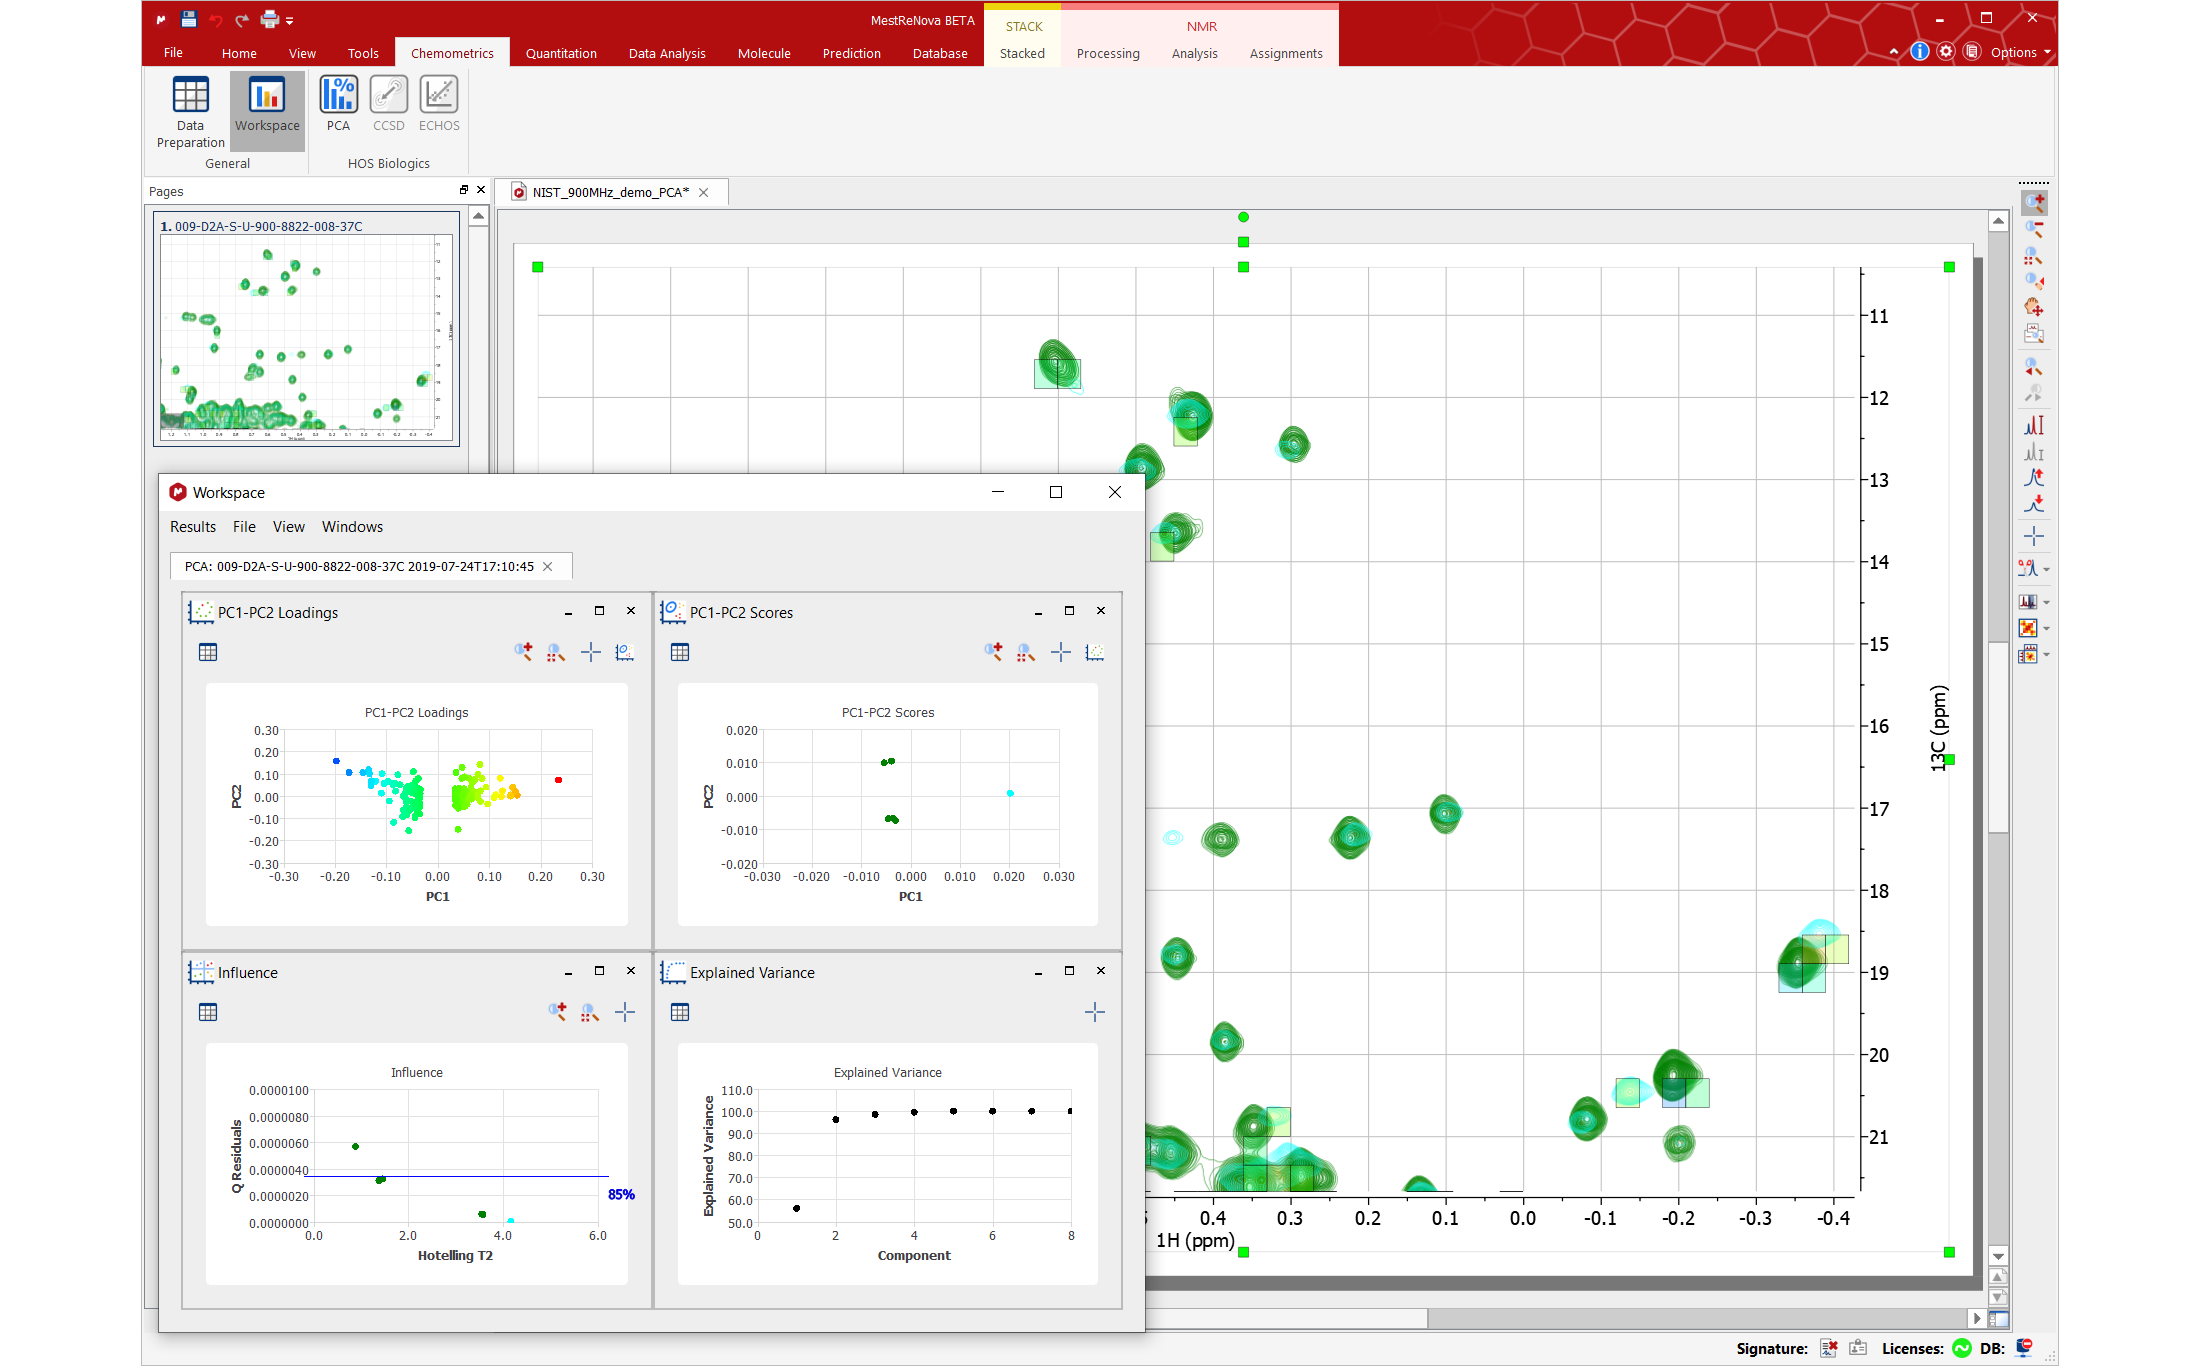
Includes several published and accepted methods to conduct analysis: – Principal Component Analysis, PCA – unsupervised chemometrics– Easy Comparability of Higher Order Structure, ECHOS – simple representation of spectral differences – Combined Chemical Shift Difference, CCSD – number that represents the shifts in peak positions – 1D Profile uses 1D NMR spectra to detect small spectral changes and carry out a statistical analysis on evaluations
Quality Assessment of Biologic drugs using 2D NMR spectral data Capitalise on a powerful, intuitive user interface Excellent, fundamental capabilities and algorithms Interactivity between the analysis results and spectral data Similarity assessment between a drug and its reference material, allowing rapid pass / fail evaluations |
MSChrom
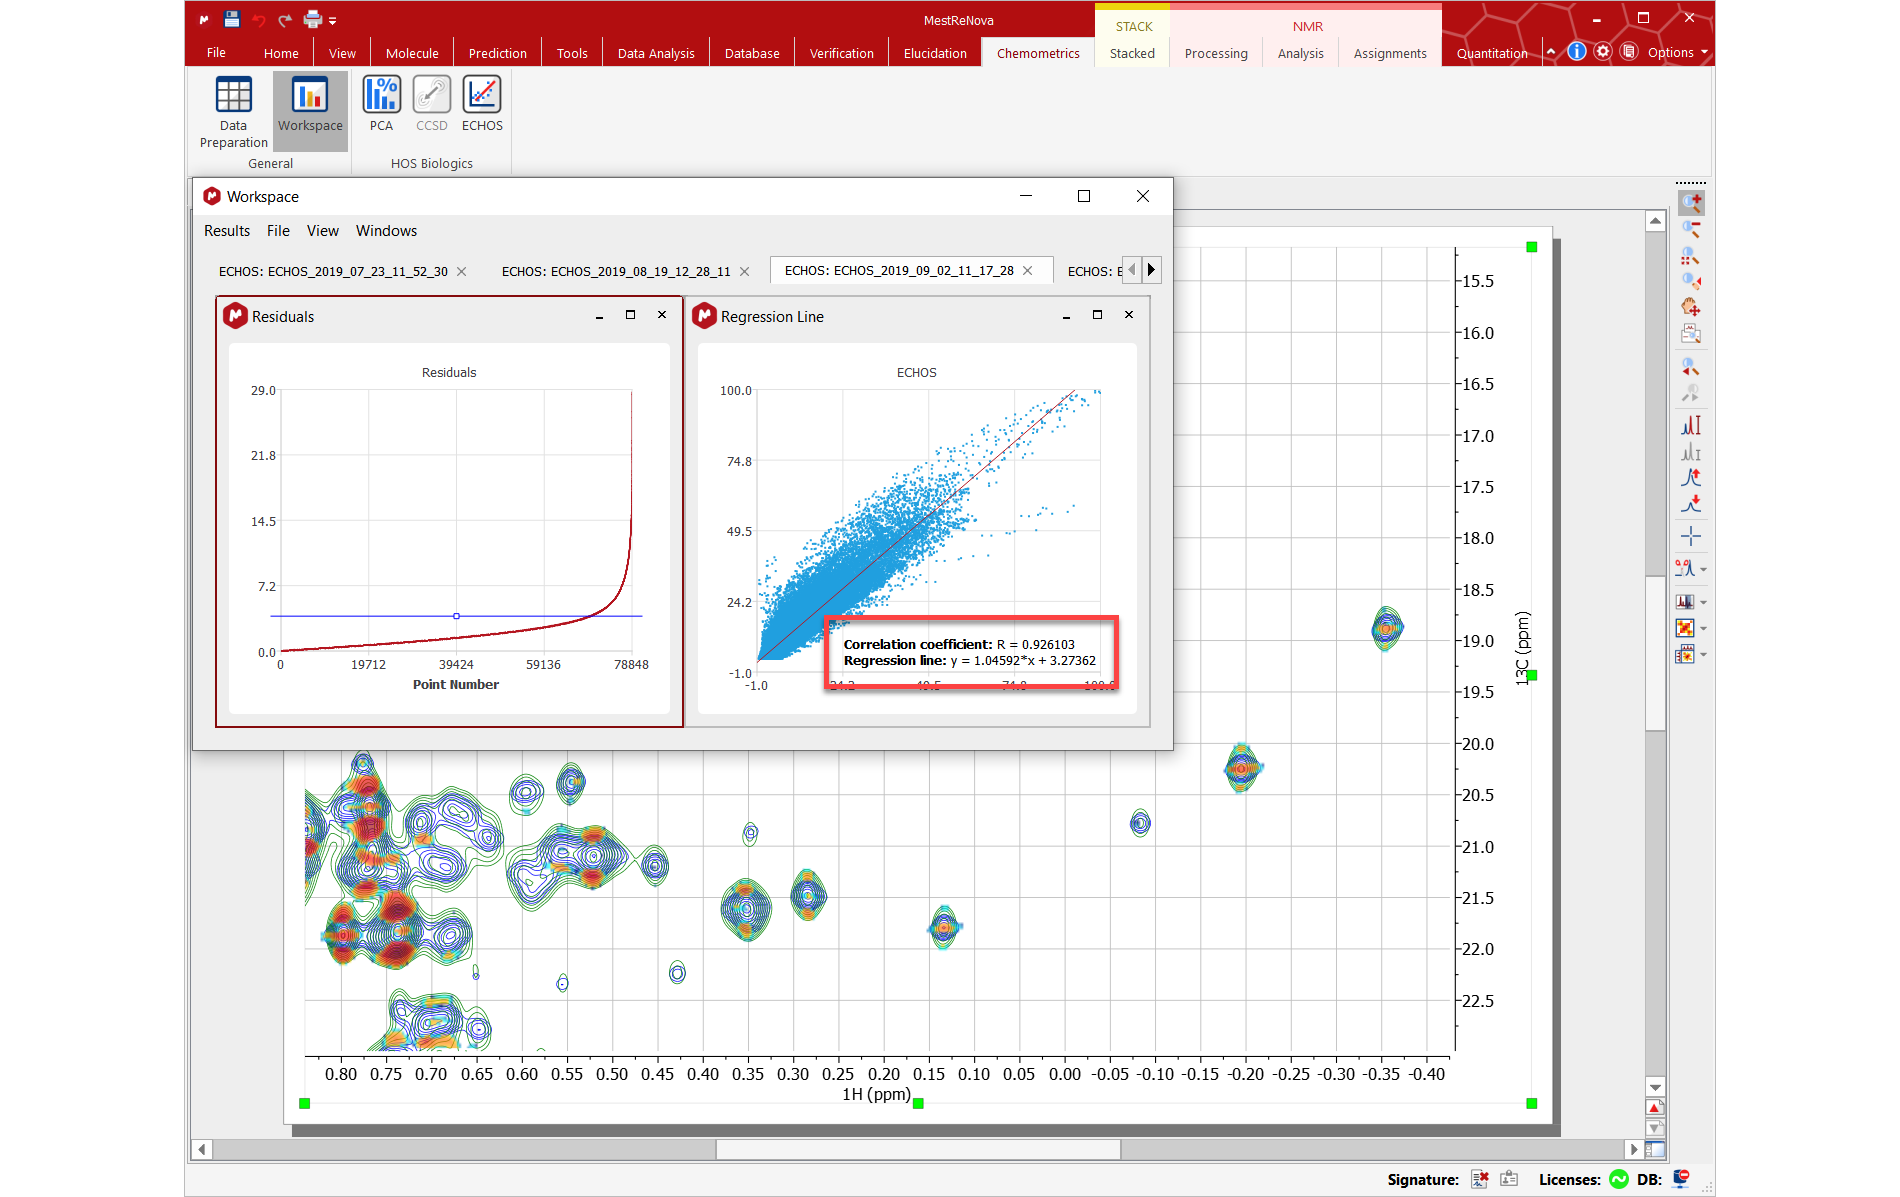
Pairwise intensity comparisons of points with the same coordinates in the reference – and test spectra
A regression line is computed for the scatter plot of points. Manual and automatic noise cancellation
Adjust threshold for residuals
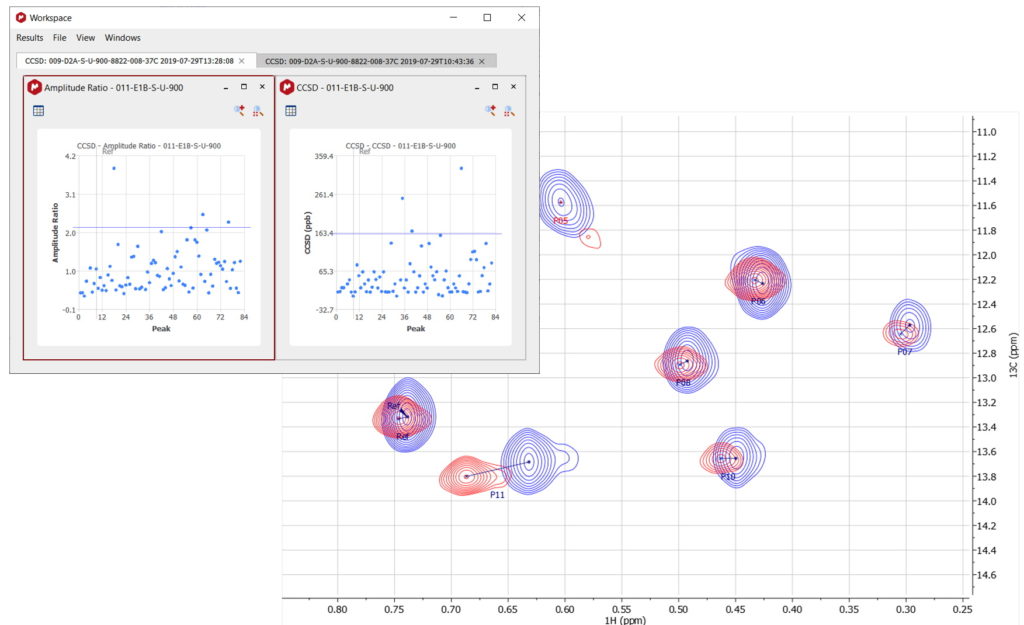
Selected peaks in the reference spectrum are matched with peaks in the test data and the Combined Chemical Shift Difference (average and per peak pair) is calculated
Average CCSD for each test spectrum, to rank them by similarity with the reference
Plot CCSD values and amplitude ratio per pair of peaks and inspect relevant spectral regions with just one click
Dedicated features for data management including: adjusting preparation parameters, binning to reduce data size, conducting integrity checks, filtering, normalizing and scaling
PCA results available in interactive plots always connected to the spectra
Explained Variance, Influence, Scores and PCA loadings plot templates available

Typically uses 1D 1H spectra
Small differences are quantified
Statistically treat spectra for many spectra

BioHOS Academic, Government & Industrial
|
|
BioHOS
|
✈:No. 377, Nanjing Road, Shibei District, Qingdao, Shandong
☏:0532-83818797 / 18561885100
✉:changzhu_ ji@tlwb.com.cn shuochao_dai@tlwb.com.cn support@tlwb.com.cn
Learn more |
 |


 鲁公网安备 37020302371618 鲁ICP备13025756号-1