Mnova Combos allow you to enjoy several Mnova plugins at the same time while you get important savings!


|
Designed to visualize, process, analyze and report various electronic and vibrational spectroscopic techniques Carry out the analysis of various optical spectroscopy data including ultraviolet and visible (UV/Vis), near and mid infrared (NIR/MIR), Raman, fluorescence, and other spectroscopic methods operating in the whole region of wavelength from 100 nm to 100 µm. > GET A LICENSE |
|
ElViS
|
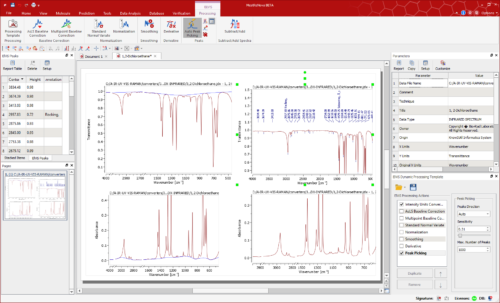
Spectroscopic processing and analysis of ultraviolet and visible (UV/Vis), near and mid infrared (NIR/MIR), Raman, fluorescence methods Vendor and Operating System agnostic, supports most data file formats Wide range of processing functions, including a dynamic processing template Manual and automatic peak picking analysis Data Analysis of stacked/arrayed spectra |
ElViS
Mnova ElViS supports most data file formats for these analytical techniques. Export Single and Multicolumn matrix-like spectra files (i.e. ASCII, as .txt or .csv). Import single and multispectral file formats:
♠ SPC(Galactic)
♠ JCAMP-DX
♠ OPUS(Bruker)
♠ Single spectrum files SPA (Omnic)
♠ Perkin Elmer blocked structured (*.sp)

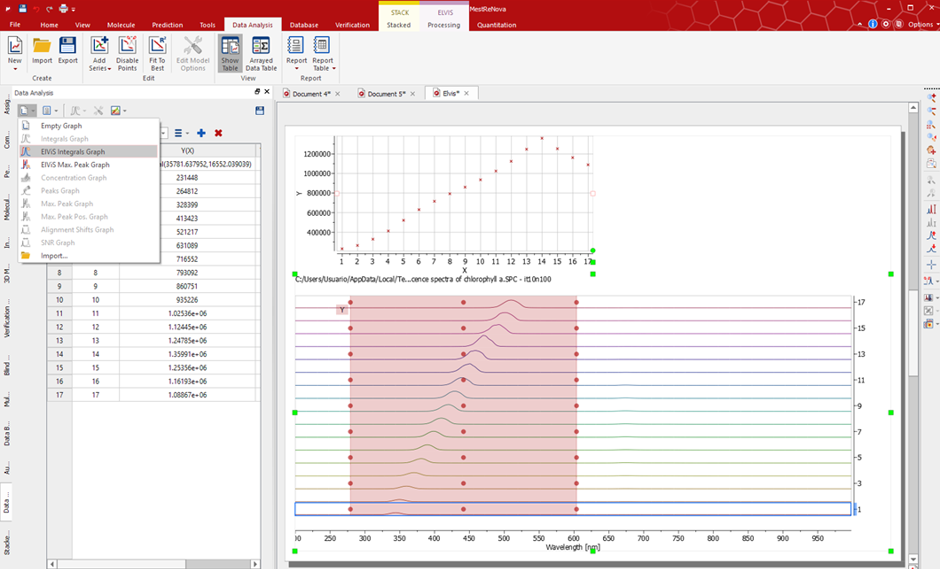
This first version of the software allows manual and automatic peak picking as well as Data Analysis of stacked/arrayed spectra.
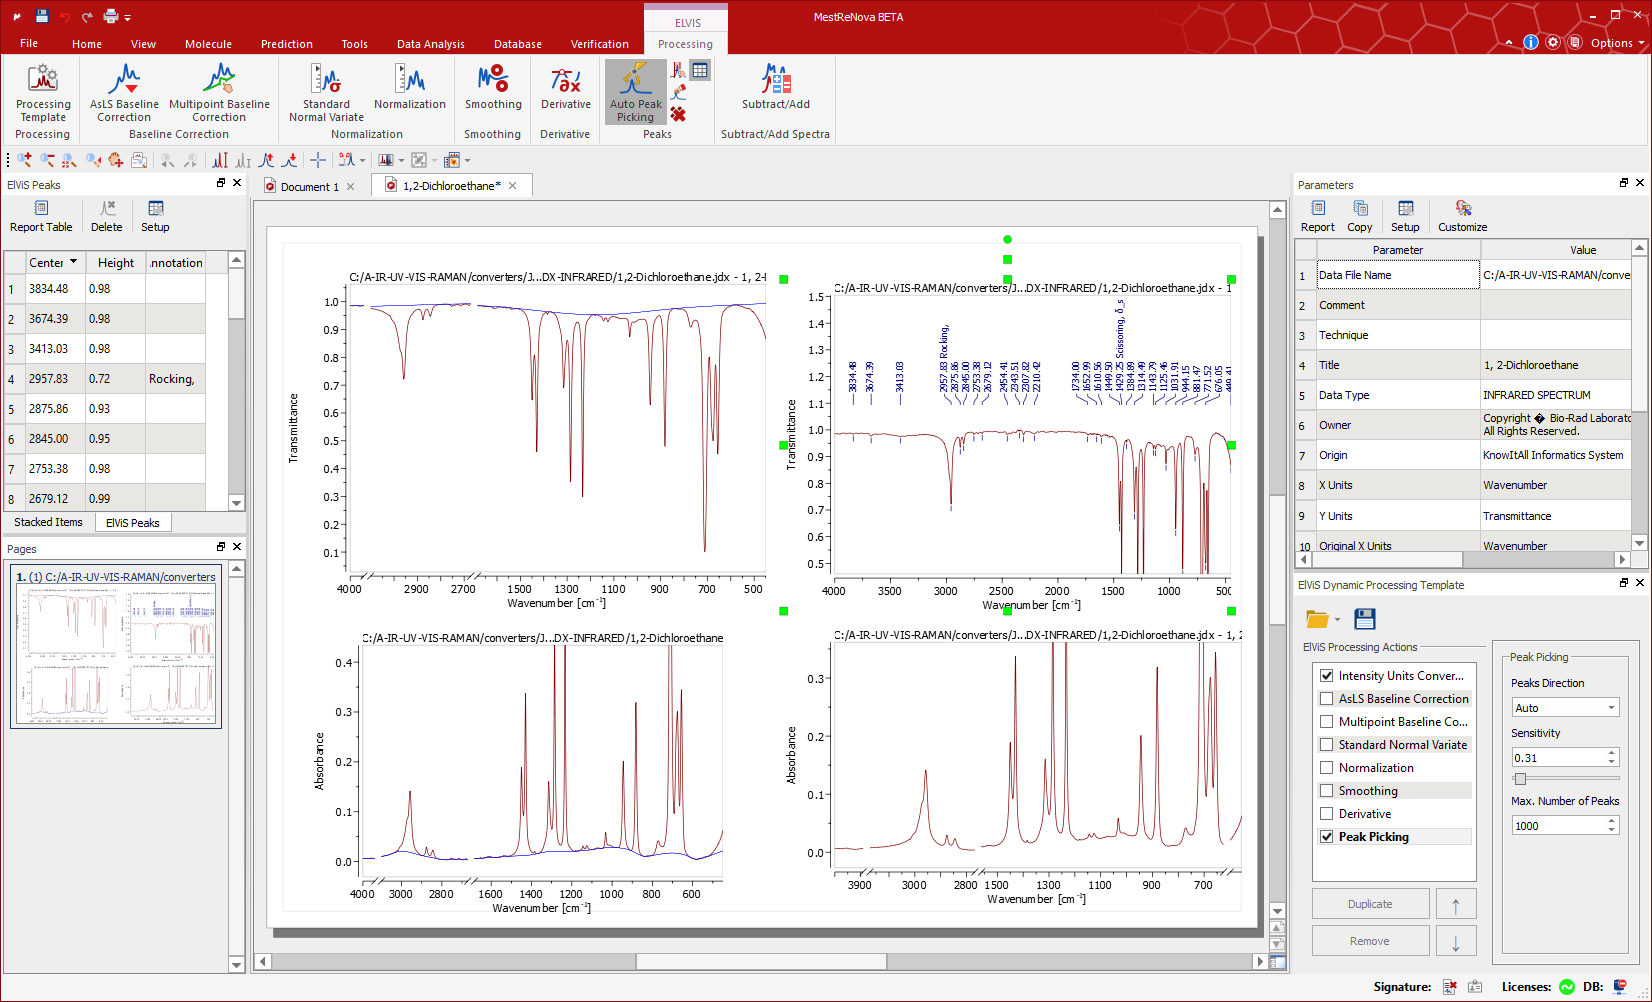
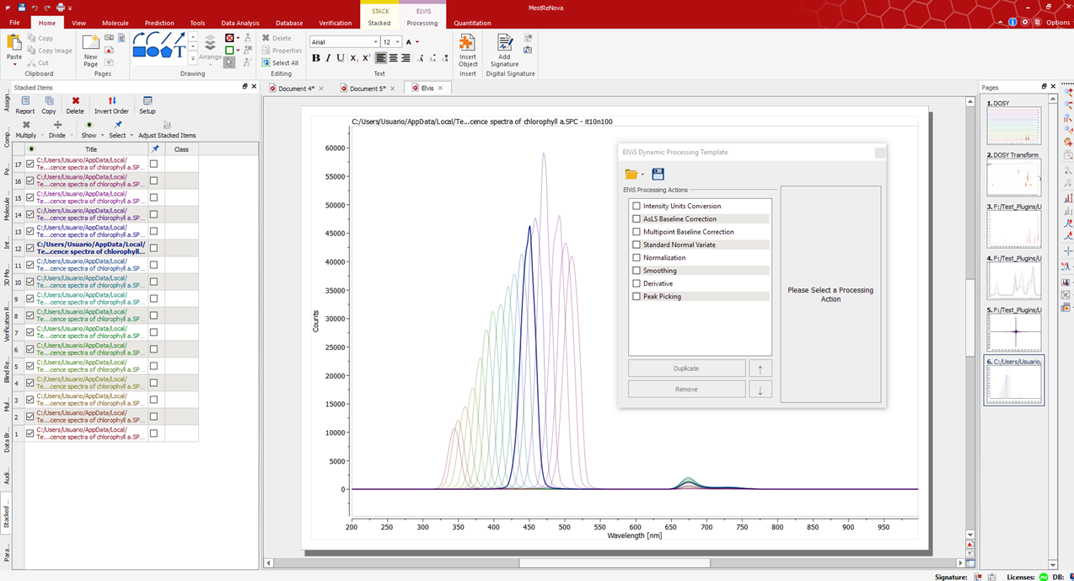
Baseline correction, both automatic (AsLS) and/or tailored (Multipoint Baseline Correction)
Several Smoothing techniques such as Savitzky-Golay, Exponential, etc.
Normalization and Standard Normal Variate (SNV)
Derivatives
Units conversion Absorbance to/from Transmittance
ElViS Markets & Practical Applications
PRACTICAL APPLICATIONS
|
|
ElViS
|
✈:No. 377, Nanjing Road, Shibei District, Qingdao, Shandong
☏:0532-83818797 / 18561885100
✉:changzhu_ ji@tlwb.com.cn shuochao_dai@tlwb.com.cn support@tlwb.com.cn
Learn more |
 |
