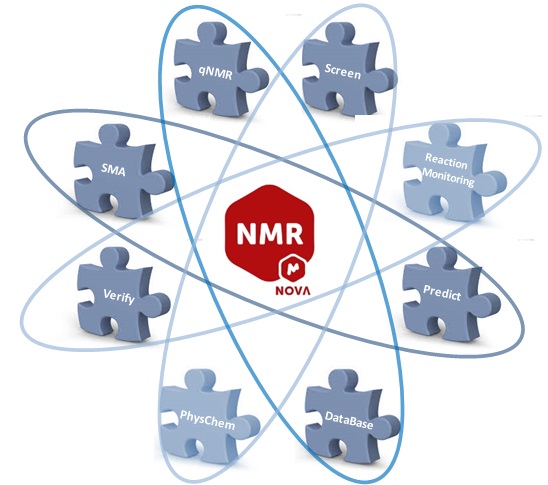
Mnova Combos allow you to enjoy several Mnova plugins at the same time while you get important savings!

|
A professional way to visualize, process, analyze and report your 1D and 2D NMR data. Supports the specific NMR needs of analytical and organic chemists. The analysis capabilities of the software are unmatched due to its very advanced algorithmia! > GET A LICENSE |
|
NMR
|
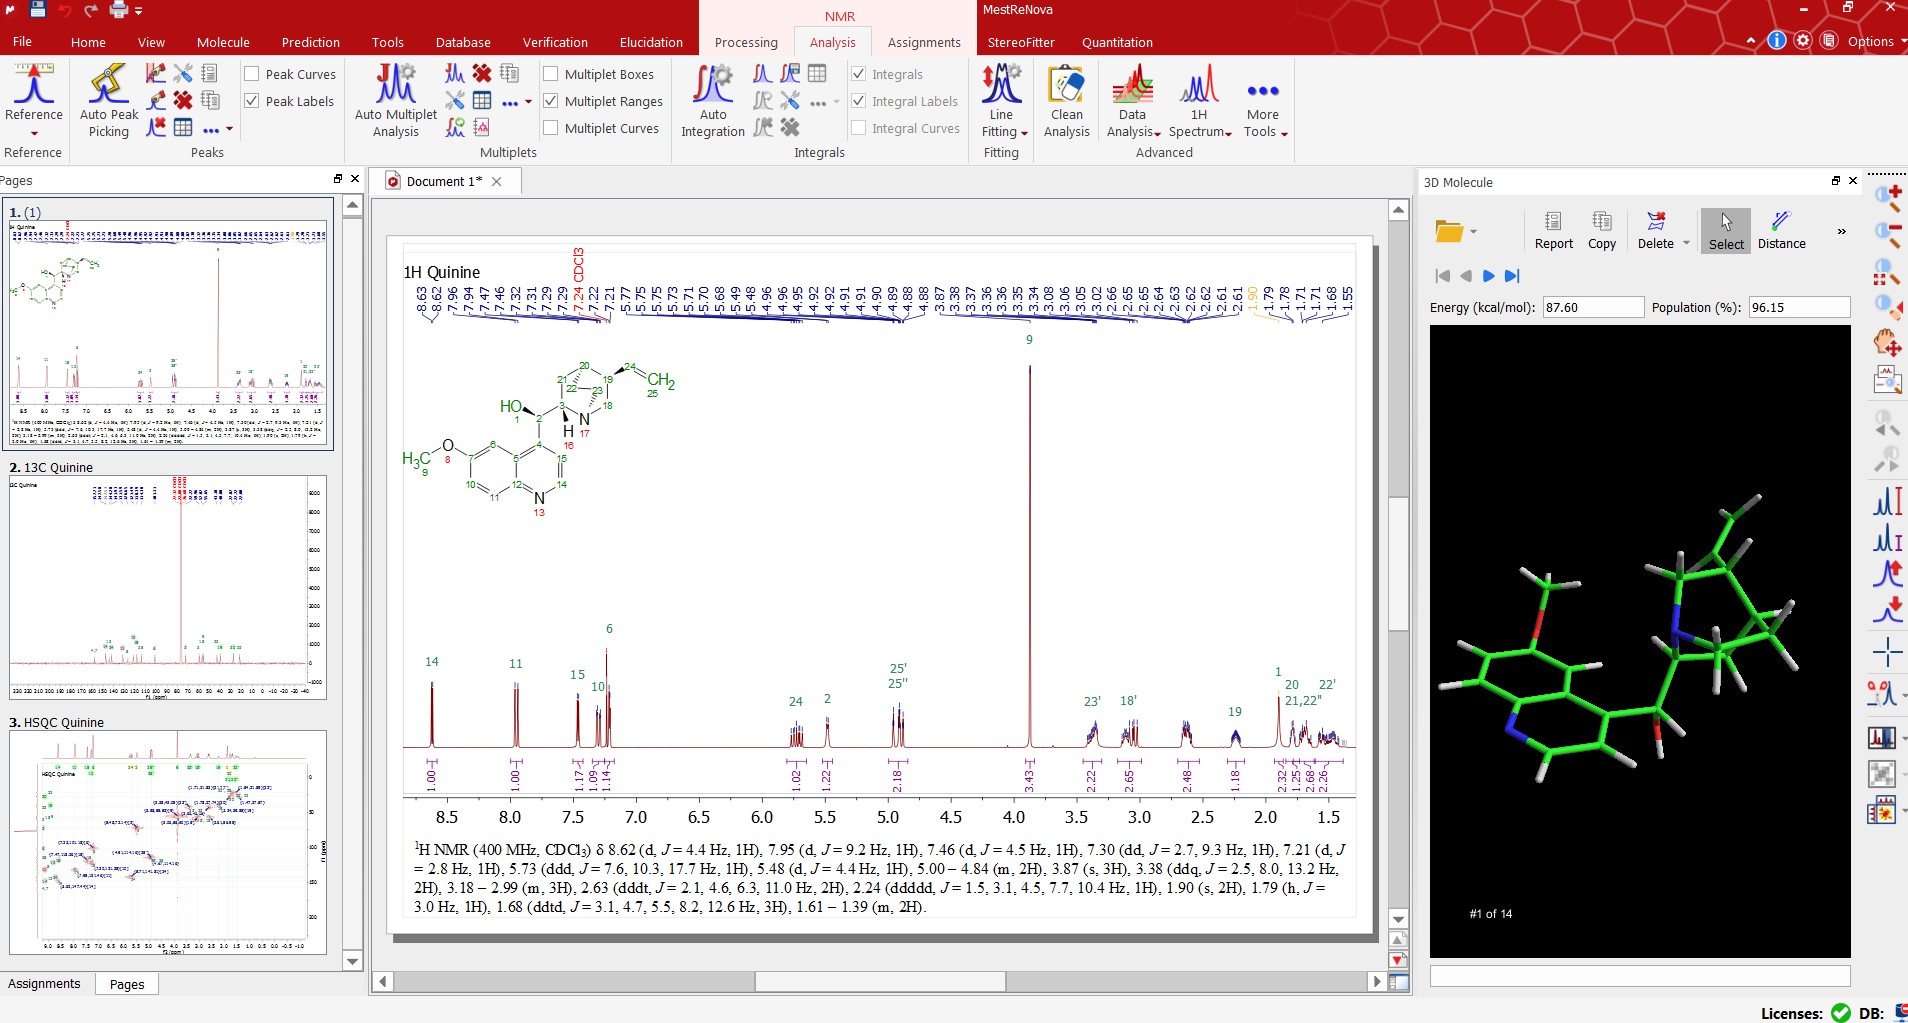
Flexibility to handle your NMR data from different magnet vendors (Agilent, Bruker, JEOL, PicoSpin, Magritek, Nanalysis, Oxford Instruments, etc.) High quality analysis of spectra (deconvolution, peak picking, integration, multiplet analysis, etc.) Process your data automatically (1H, 13C, DEPTs or any other 1D NMR as well as any 2D NMR correlations, such as HSQC, HMBC, NOESY, COSY, TOCSY, etc.). Optimize your results interactively. Build high quality, publication-ready reports whilst working up the data. Save time by using reporting and processing templates and scripting tools to automate your workflows. |
NMR
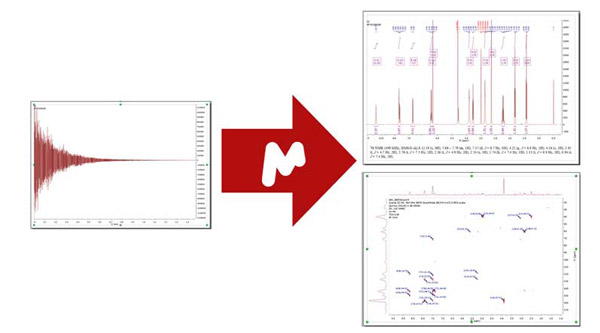
The Mnova NMR plugin offers the shortest way from an FID to a fully processed spectrum ready to be analyzed. It is ideal both for the non-expert NMR user looking for an easy way to learn a piece of software which delivers quick, high quality results with minimum effort. It also works very well for the expert user looking for extensive advanced processing functionality.
You can just drag and drop your 1D and 2D data from any NMR vendor and get your spectrum auto-processed on-the-fly and ready for analysis. You will achieve excellent results with minimum effort.
For those who would like to optimize the spectral processing interactively, our real time frequency domain processing allows users to make changes to time domain functions and see the result in real time on the frequency domain, thus achieving better results faster. Although the software will process spectra without user intervention to the standard needed by 95% of users, in Mnova NMR you will find a wealth of advanced processing features for those with more advanced processing needs.
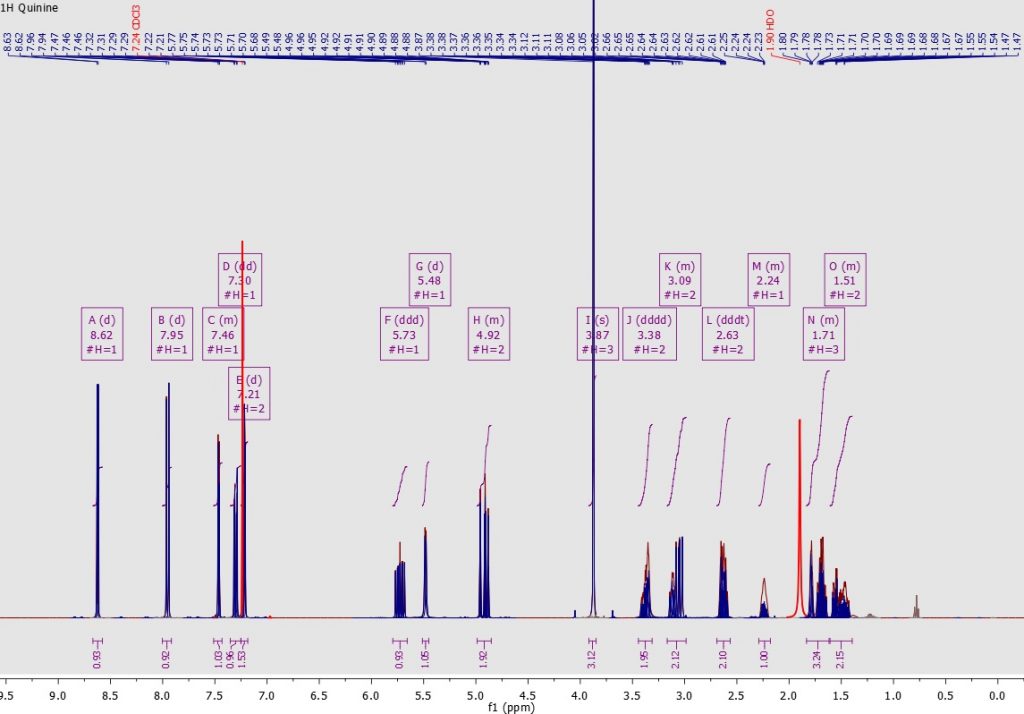
The automated spectral analysis algorithmia in Mnova NMR performs analysis in the way a chemist would. The aim to automatically classify every peak, according to fuzzy logic analysis of different descriptors, into categories ranging from peak compound, impurities, 13 C satellites, solvent, etc.
Automatic Spectral Analysis has never been so powerful. Our automatic analysis performs a Global Deconvolution (GSD) of the full spectrum (including a resolution enhancement step) to separate all available signals. The software then characterizes and labels each individual peak within a specific category (compound, impurity, 13 C satellite, solvent, etc.) and, once this step has been completed, analyzes the compound signals, grouping them into relevant multiplets integrating them, labeling peaks, etc. A fully automatic process will take you to the point where you would like to get when analyzing your spectra and, just in case you wanted to optimize the analysis, you will have full interactive control at every step.
Mnova NMR is a basic plugin containing the advanced functionality offered by the advanced plugins available within Mnova such as mixtures analysis, reaction monitoring, quantitation, chemical shift prediction, screening, verification as well as physico-chemical properties prediction.
Many of our advanced plugins rely on data opening and the analysis capabilities afforded by Mnova NMR to deliver their results. For example:
Mnova NMR and NMRPredict Desktop can be combined to fully automatically assign 1D and 2D NMR peaks and multiplets to atoms on a molecular structure and, therefore, give the user greater structure understanding.
Mnova NMR, NMRPredict Desktop and Verify can be combined to automatically evaluate the correctness of a structure proposal, or to select the best fitting structure from several candidates.。
Mnova NMR and Mnova qNMR can be combined to automatically calculate the concentrations or purities of our samples on the basis of their NMR data.
Mnova NMR and Mnova Reaction Monitoring can be combined to automatically extract reaction kinetics and determine reaction endpoint.
Mnova NMR and Mnova DB can be combined to mine analytical knowledge within a group or department and to benefit from analysis performed by colleagues, or ourselves, in the past.
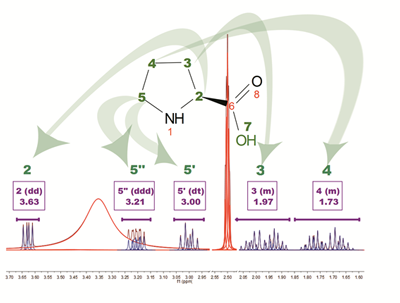
Mnova NMR allows an efficient working environment for peak assignment for multiple spectra since it can combine spectra, structure and assignments table on the same interface!
You can easily assign your spectra in manual mode by assigning multiplets to atoms. The assignments will be automatically transferred to the other spectra in the document. Automatic assignment deductions from 2D spectra will be applied when possible which will make the whole assignment process easier and quicker.
With the ‘Assisted Assignment mode’ a 1H and 13C predictions are made in the background. When hovering the mouse over the atoms of the molecule or over the multiplet boxes in the spectrum, the suggested assignments will be highlighted (following a color code depending on the quality of the assignment: green, yellow, red).
Alternatively you can use the automatic mode. The Auto Assignment Algorithm combines several software techniques we had developed in recent years as tools for expert tasks such as automatic detection and characterization of spectral peaks, automatic solvent detection, and automatic structure verification.
From Mnova 11, automatic assignment is also available for 2D HSQC and 13C spectra as well as you can displaying the HMBC/ROESY/NOESY connectivities for assigned atom pairs.
You can check the latest improvements on assignments implemented in Mnova in our changelog.
The Mnova NMR Graphical User Interface allows you to interact with multiple 1D and 2D NMR spectra quickly and simply, with different visualization, handling and analysis modes.
There are many reasons why a chemist may want to work with several spectra at the same time, and Mnova NMR makes this process extremely easy. Whether you are working up a set of 1D and 2D NMR spectra for a given sample, or you want to compare several 1Ds (maybe experimental or predicted, or 1Ds acquired at different concentrations or in different samples) or even several 2Ds (for instance for structure determination by comparing HSQC and HMBC), Mnova NMR allows you to visualize multiple spectra in the same document and analyze them together. For convenience and with a single click, Mnova allows you to bring a series of spectra together and visualize them in different ways (stacked, superimposed, etc.).
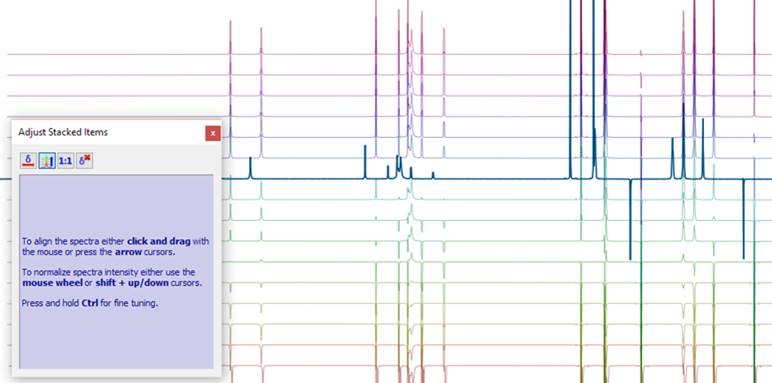 The superimposition and stacking functionality does not only apply to experimental spectra. Providing should you have a license for the NMRPredict Desktop plugin, you can use it to easily compare experimental with predicted spectra, to validate your structure hypothesis.
Mnova incorporates a ‘Data Analysis’ feature for the analysis of an array of 1D NMR experiments. It has the ability to handle multiple series, for example it’s possible to analyse the decay of several resonances within the same experiment, or a series of peak shifts during a titration.
This feature covers several applications such as diffusion and relaxation (T1/T2) experiments, kinetics, reactions monitoring, titrations, etc. With this feature you will be able to extract the peak intensities and integrals in a tabular form from series of 1D NMR experiments and draw graphical representations of the extracted values. When adding a new region, Mnova Reaction Monitoring provides the capability to automatically track peaks that change their position through the time course of a reaction. The auto track algorithm is based in the region selected in the active spectrum.
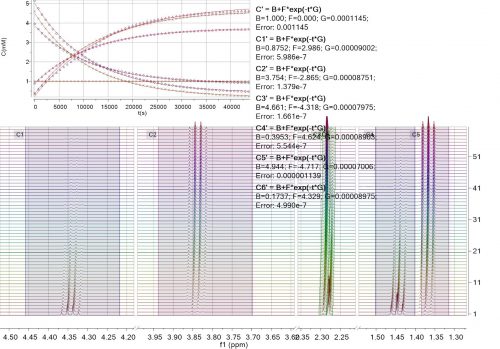 Data analysis also allows you to fit the obtained curve with a pre-defined list of equations, or any equation pre-defined by you.
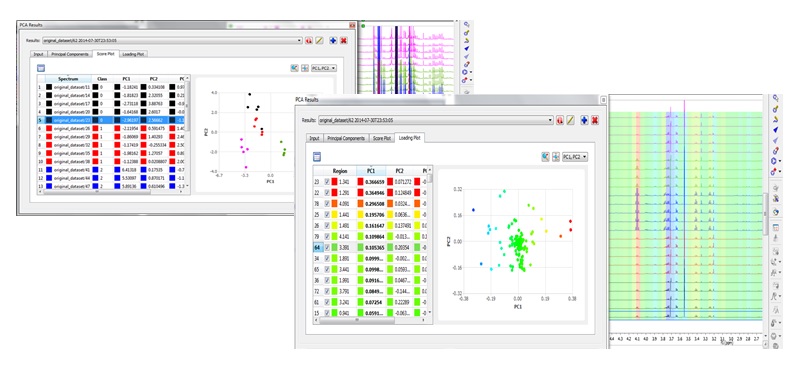
Mnova NMR offers two main tools that address multivariate analysis: binning and principal component analysis. Note that these tools require a separated license!
Chemometrics module is accessed under the Advanced menu and broadly involves three subsequent steps: (1) matrix generation (2) matrix pre-processing and (3) principal component analysis. PCA (Principal Component Analysis) under Mnova gives you the possibility to generate and interact with PCA plots and spectra at the same time. The user friendly interface provided by Mnova will be of great advantage also for spectroscopists who are not familiar with multivariate analysis but would like to learn more and test it.
NMR Academic, Government & Industrial
|
|
NMR
|
✈:No. 377, Nanjing Road, Shibei District, Qingdao, Shandon
☏:0532-83818797 / 18561885100
✉:changzhu_ ji@tlwb.com.cn shuochao_dai@tlwb.com.cn support@tlwb.com.cn
Learn more |
 |
