
Mnova Combos allow you to enjoy several Mnova plugins at the same time while you get important savings!


|
Designed to provide fundamental support and extraction of spectroscopic and chemical kinetic concentration from arrayed NMR datasets. Collect your NMR spectra at regular intervals through the course of a chemical reaction. > GET A LICENSE |
The key to unlocking the information from your NMR reaction monitoring experiments
|
ReactionMonitoring
|
Mnova makes the analysis of RM data simple, providing a sophisticated suite of software solutions to what can be somewhat tricky data to analyse.
Complex reactions and large data files can be analyzed very quickly and easily. Provides a versatile suite of data import tools. Metadata is extracted, for example to automatically build a time axis. Excellent spectral processing capabilities:Autophase Peak alignment Automated data analysis as the data are produced by the spectrometer. Use the built-in tools to construct a curve of concentration vs time – the correct way to analyse reaction kinetics. |
ReactionMonitoring
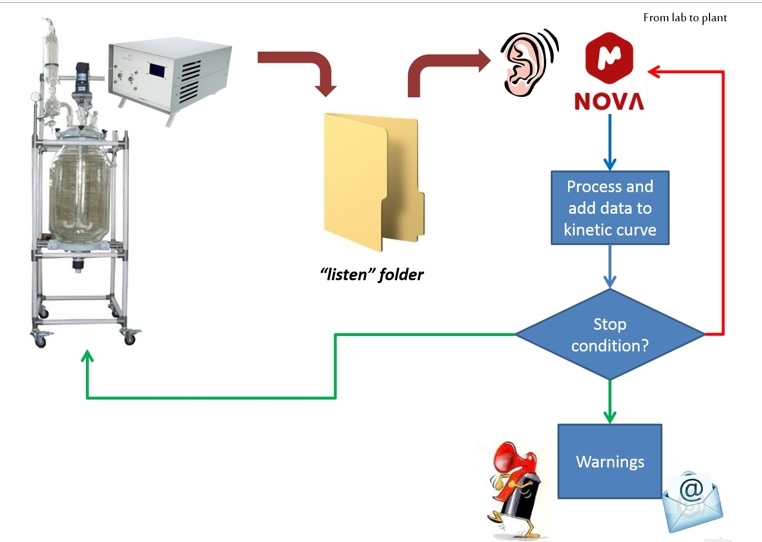
Fully unassisted reaction monitoring analysis and report of your datasets. All your kinetic parameters and reaction endpoints are determined as soon as data are acquired and found in a predefined location folder.
Each new spectrum is added to the existing analysis, curve fitting parameters are updated, and component concentration can be tracked, so that the analysis is conducted without user intervention.
The combination of the Real Time RM with Mnova’s scripting capabilities can allow you to fully automate currently time consuming workflows.
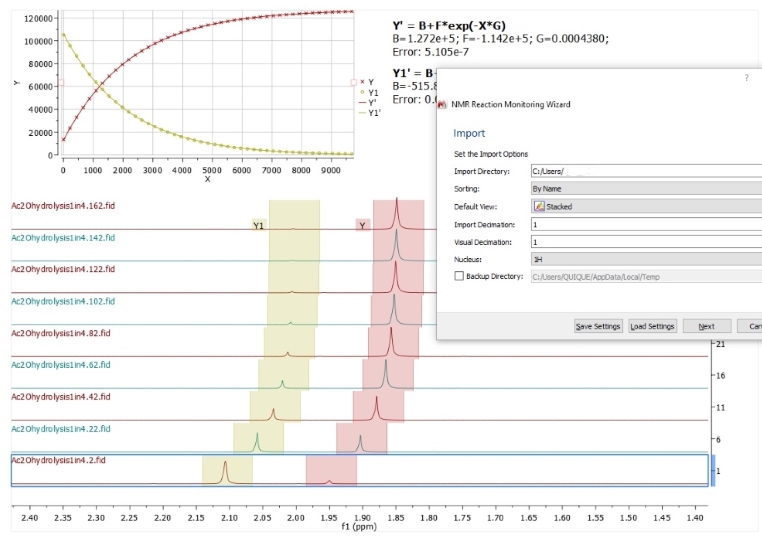
A simple graphical user interface will guide you in the process of setting up your Real-time RM, so that analysis set up takes a couple of minutes and requires no specific expertise.
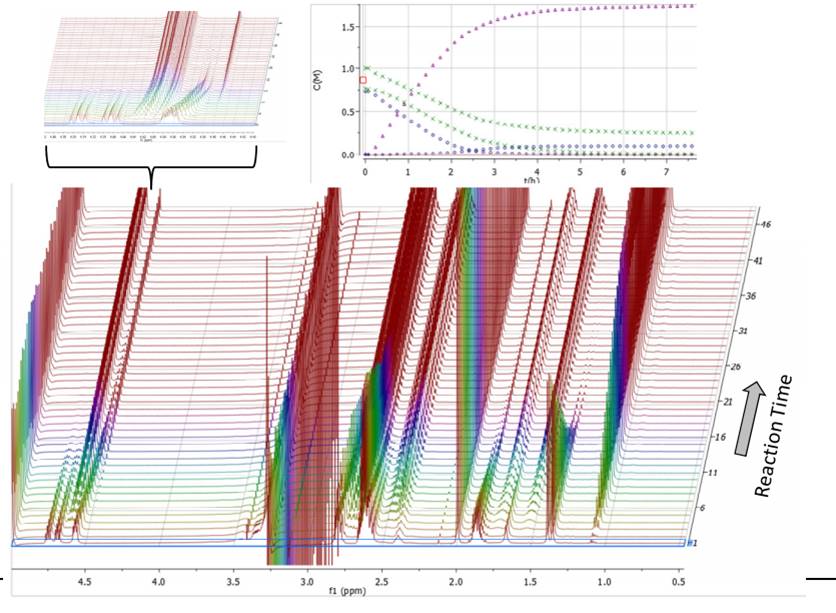
Mnova RM provides an environment to easily work on reaction data in the usual concentration v time way.
Mnova allows you to separate the raw data into separate kinetic analyses. The time at which each spectrum was acquired is read and used to build the final x-axis in the kinetic plot.
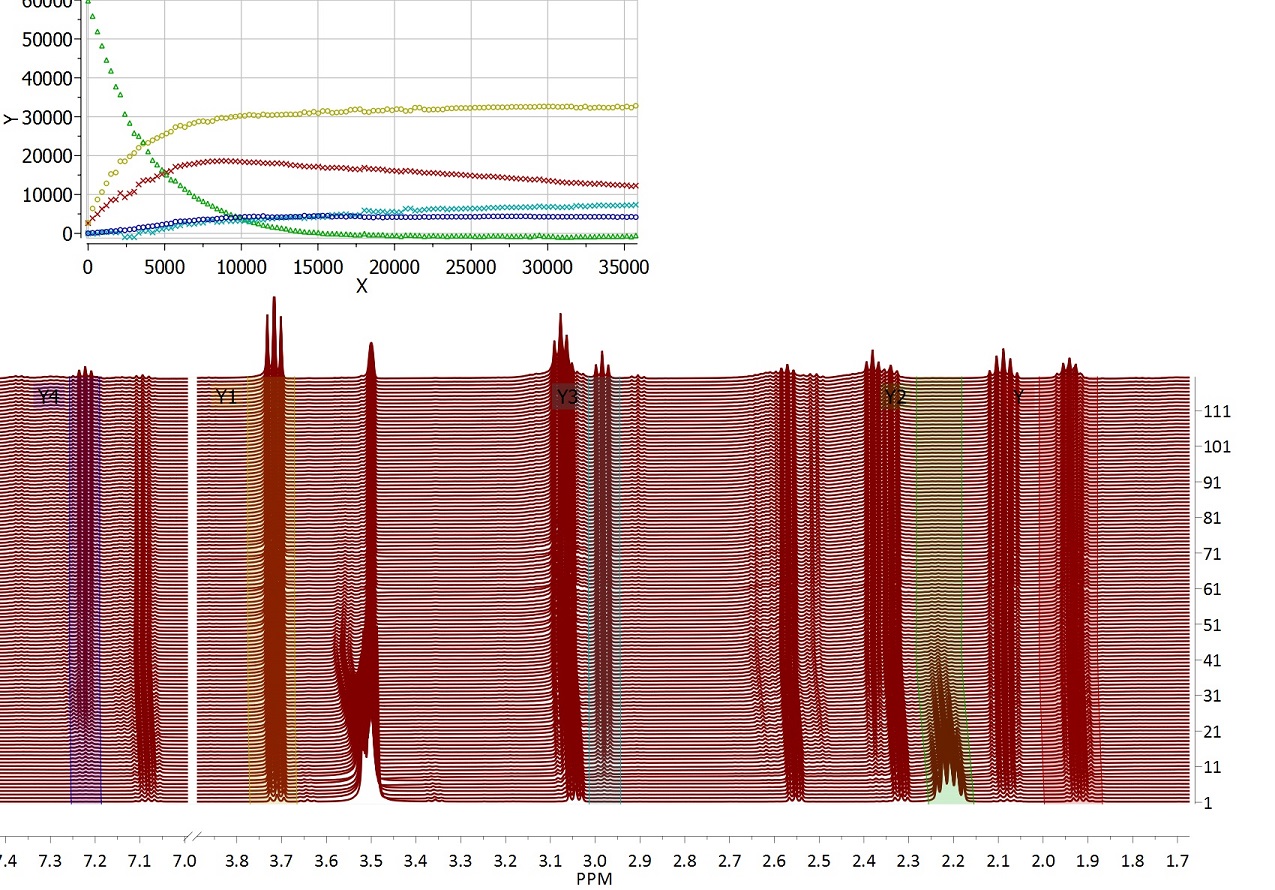
Mnova provides a host of powerful data processing tools to deal with poor baseline, changing phase, strong interfering (solvent) signals. Difficult peak area determination can be addressed using GSD. The spectral array can be further curated by individual reprocessing.
Finally, the kinetic curve data points can be fit to a specified mathematical function to determine the kinetic parameters. An exponential fitting function is powerful and fast.
ReactionMonitoring
Academic, Government & Industrial
|
|
ReactionMonitoring
|
✈:No. 377, Nanjing Road, Shibei District, Qingdao, Shandong
☏:0532-83818797 / 18561885100
✉:changzhu_ ji@tlwb.com.cn shuochao_dai@tlwb.com.cn support@tlwb.com.cn
Learn more |
 |


 鲁公网安备 37020302371618 鲁ICP备13025756号-1